Sales Tracker Dashboard - Excel
Description
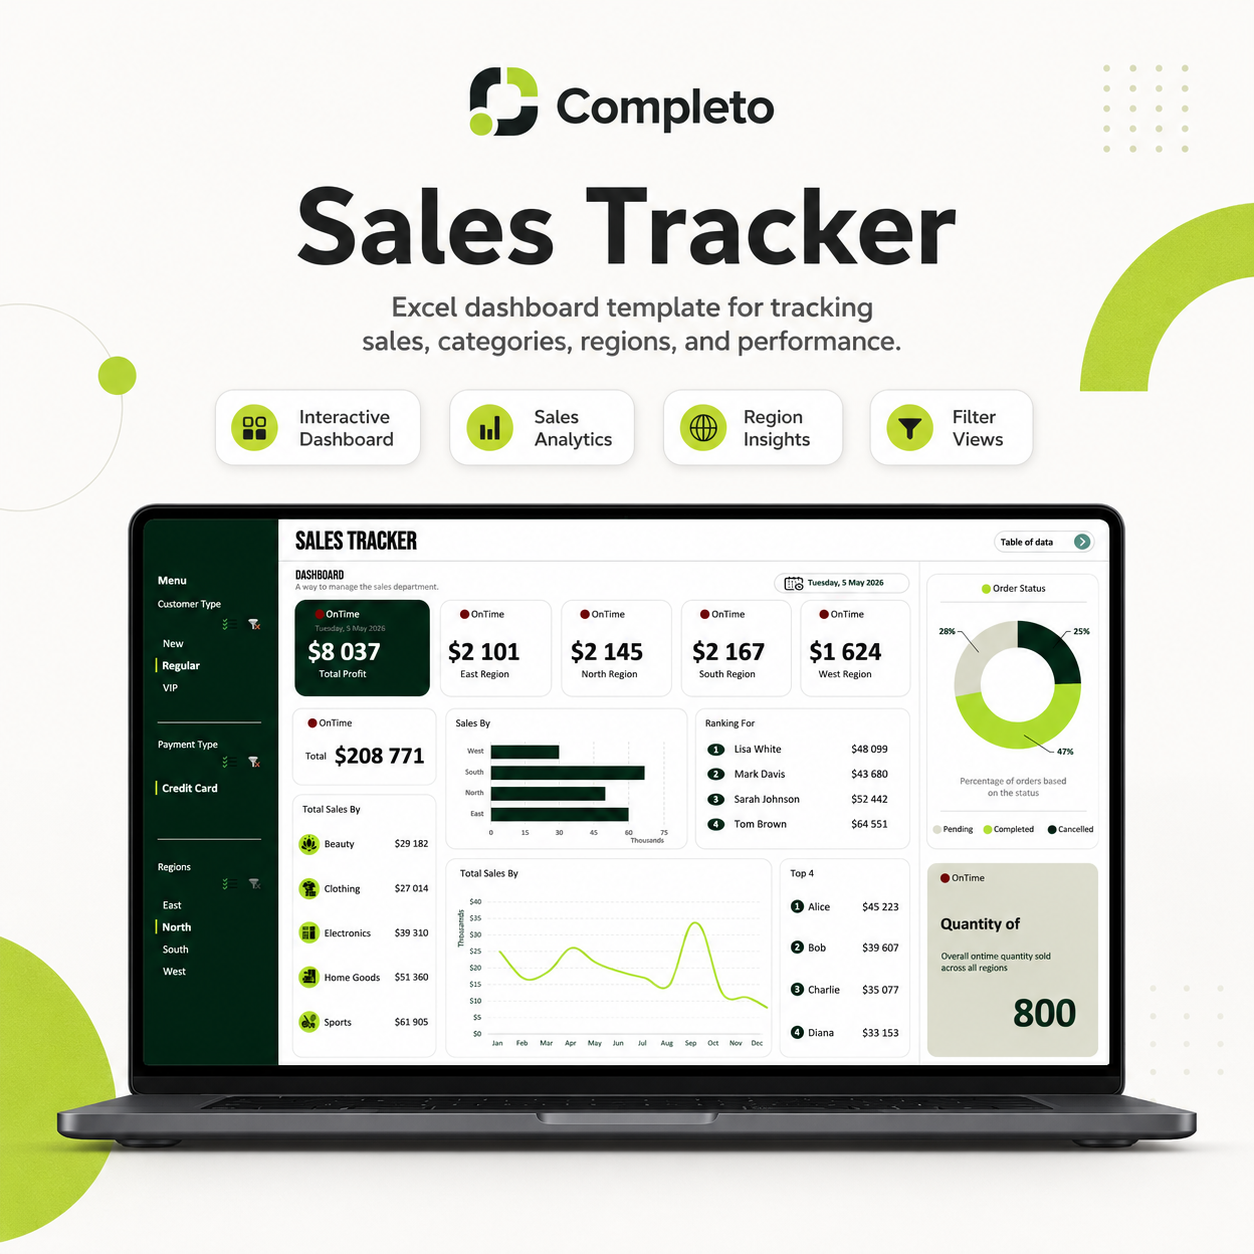
Most businesses track sales in scattered spreadsheets with no clear picture of performance. This template gives you one clean dashboard that shows exactly how your sales are performing — by region, customer type, payment method, seller, and month.
What's included
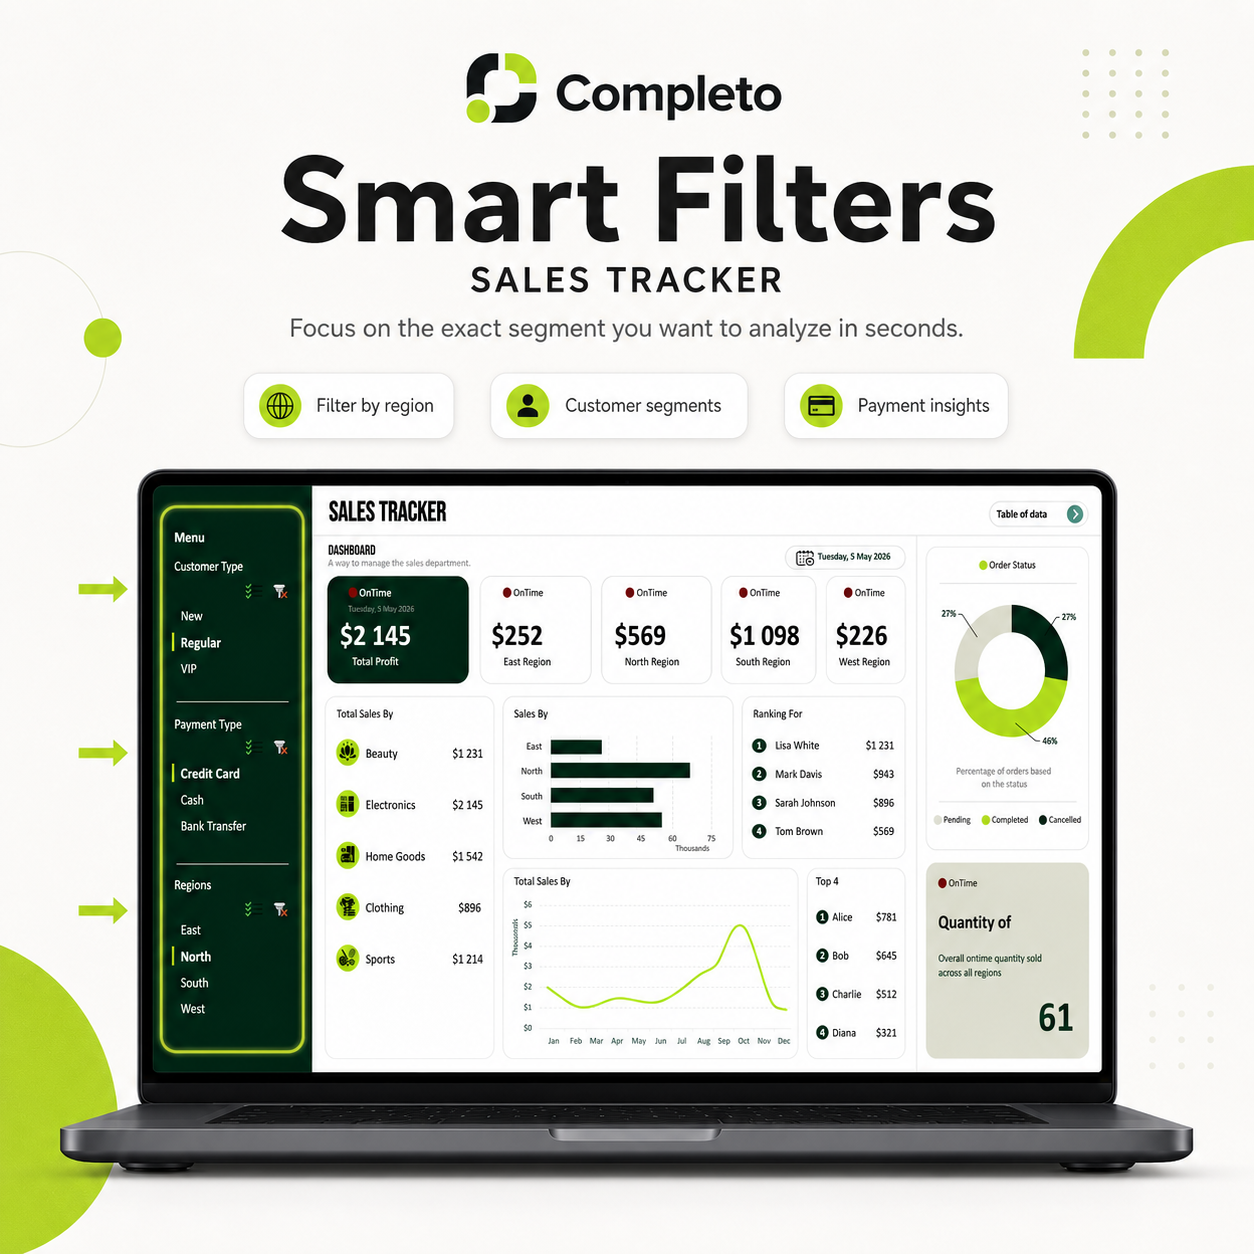
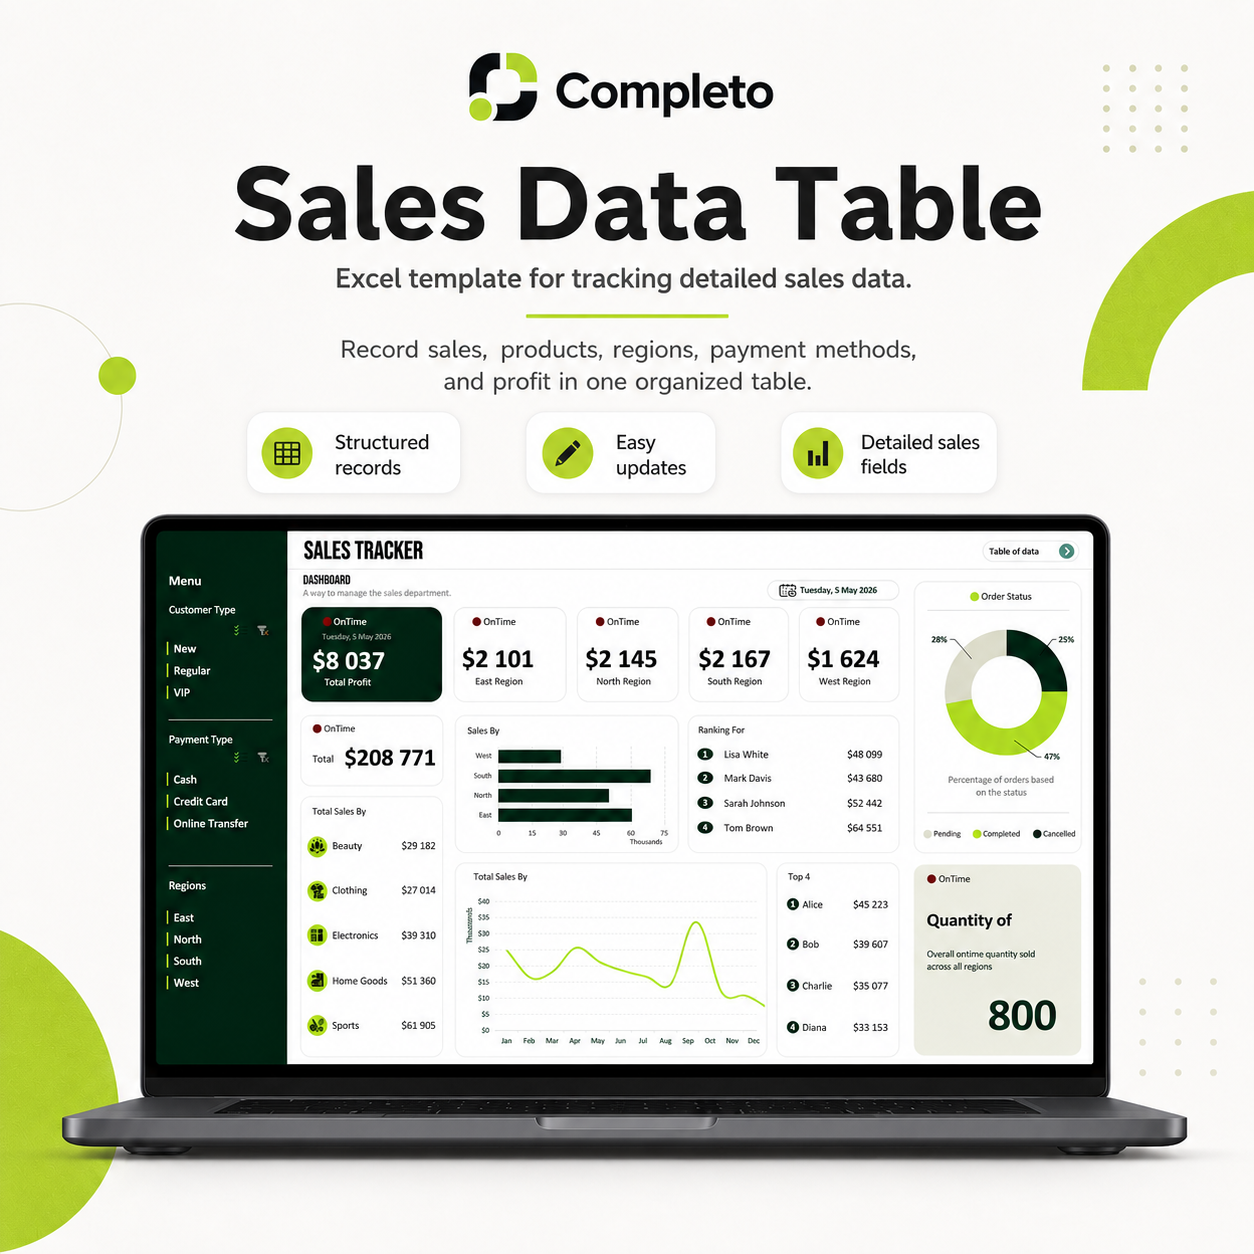
- Sales dashboard with interactive filters and visual charts
- Total sales, profit, and order count cards
- Filter by region, customer type, payment method, and order status
- Top performing sellers and categories ranking
- Month by month sales comparison
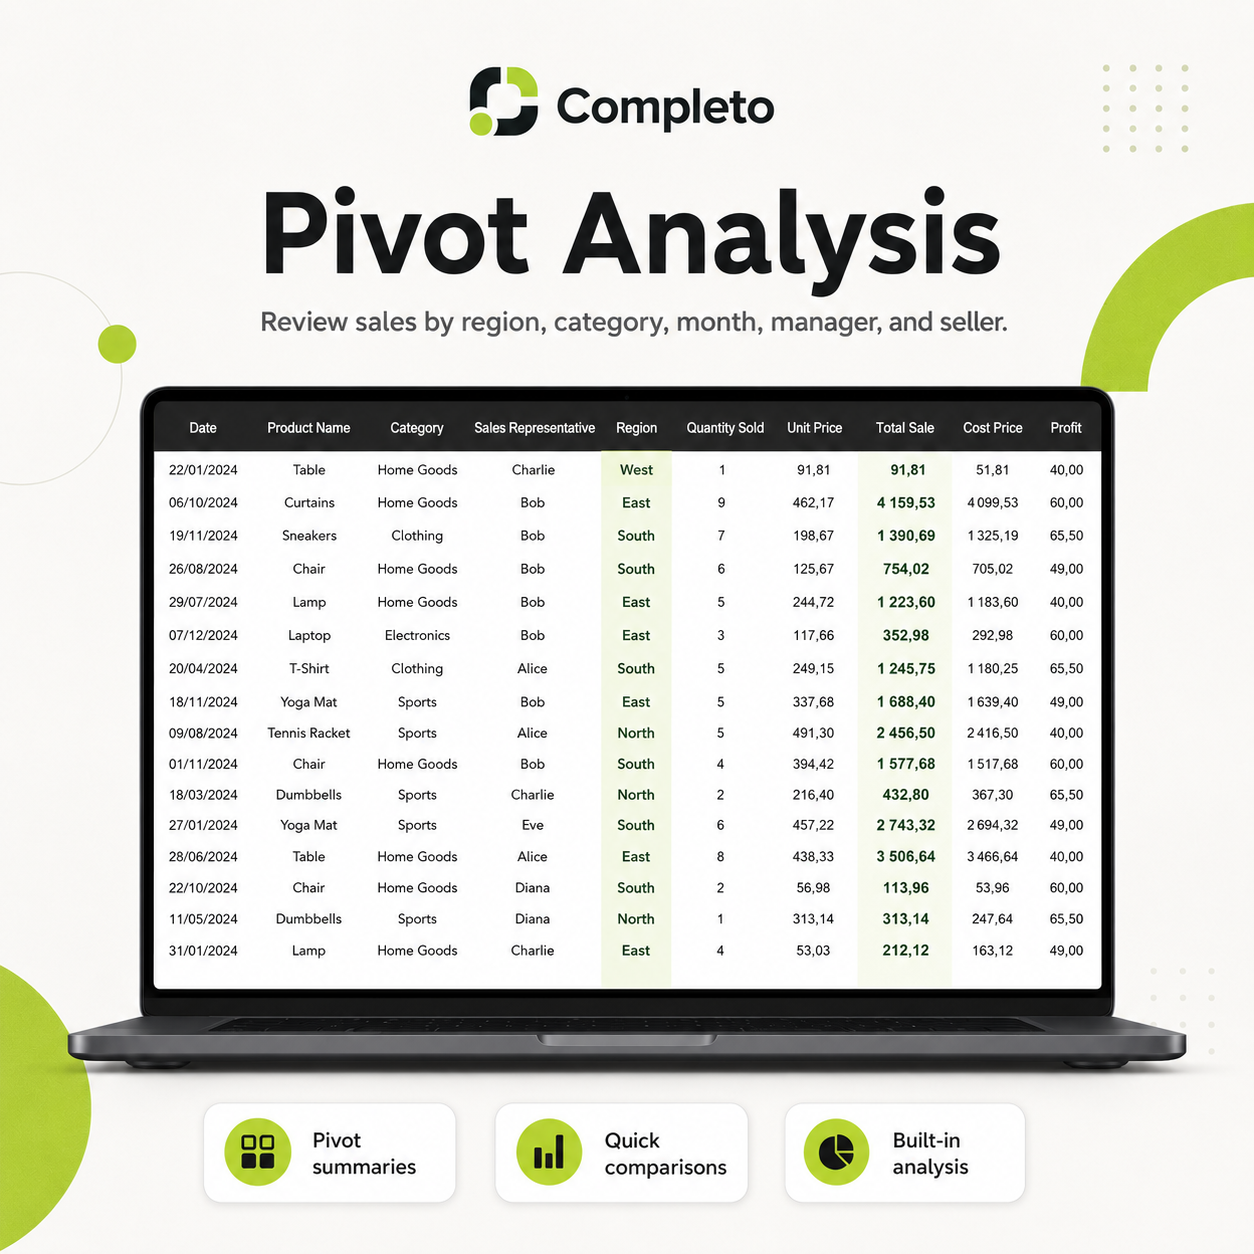
- Pivot analysis section — drill into any dimension of your sales data
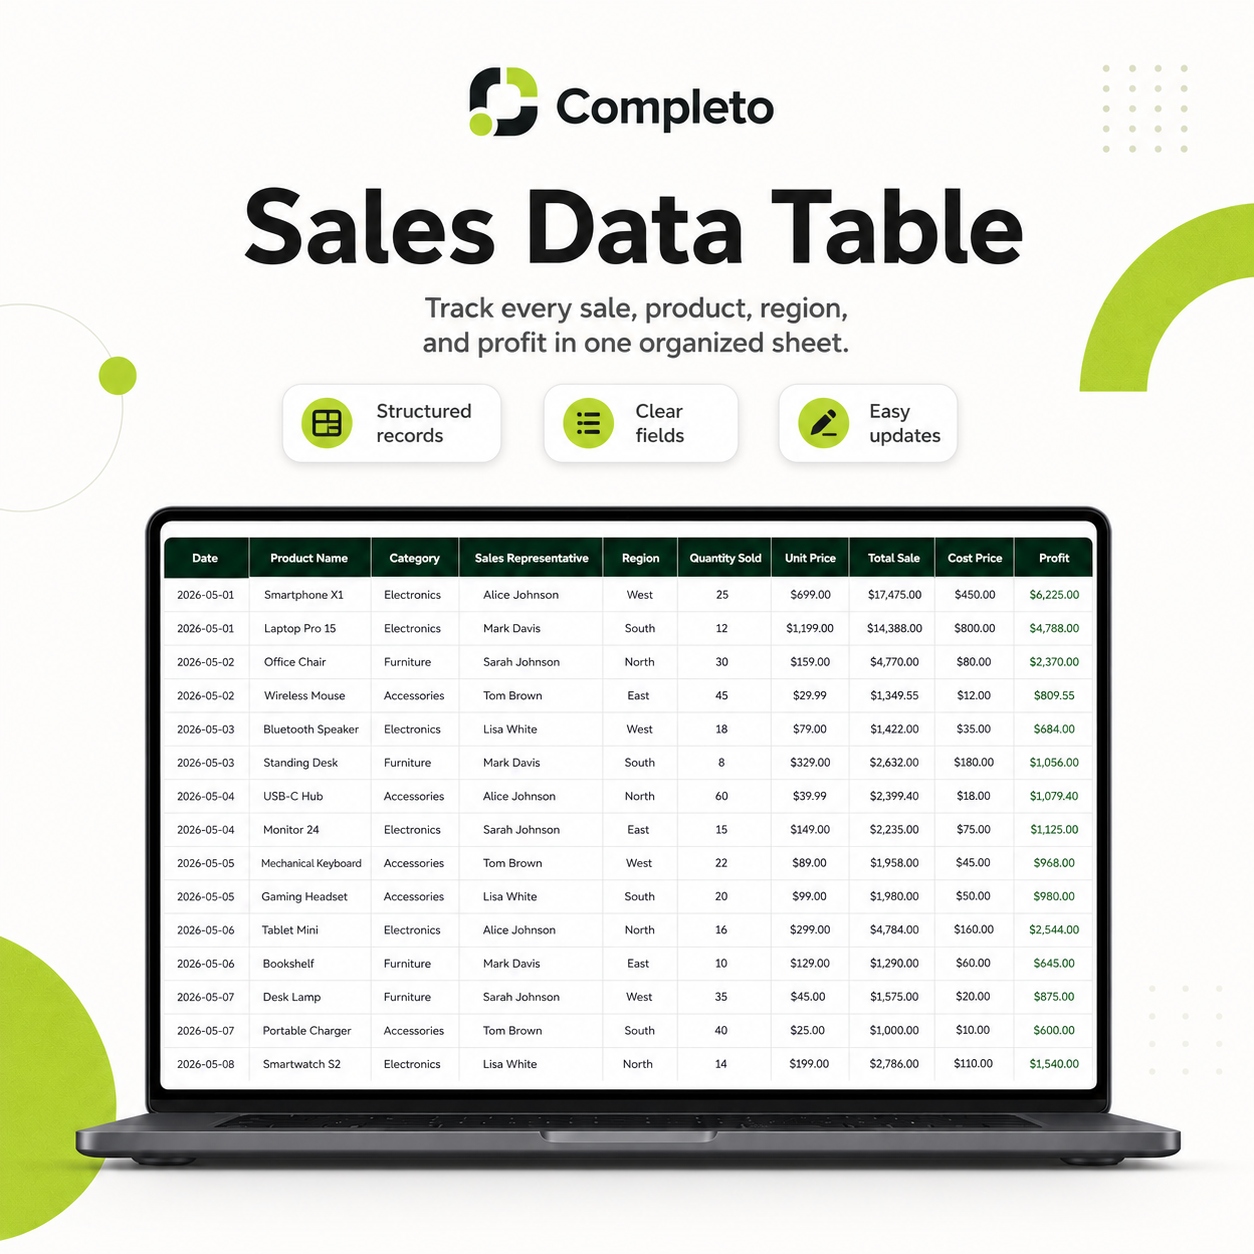
- Structured sales data table — add your records and the dashboard updates
- Fully editable labels, categories, regions, and customer types
Who this is for
- Small business owners tracking revenue and profit
- Sales managers reviewing team performance
- Freelancers and agencies tracking client revenue
- Anyone who wants to understand their sales data without building reports from scratch
How it works
- Enter your sales records in the data table
- Dashboard updates automatically
- Use filters to drill into specific regions, customers, or time periods
- Review pivot analysis for deeper breakdowns
- Copy the file for each month or quarter
FAQ
Do I need Microsoft Excel?
Yes. This template is designed for Microsoft Excel.
Is this a digital product?
Yes. After purchase, you receive instant access to download the Excel workbook.
Can I edit the template?
Yes. You can edit the data, categories, regions, customer types, payment methods, and labels.
Does it include a dashboard?
Yes. It includes a visual sales dashboard with filters, charts, rankings, and summary cards.
Can I add my own sales data?
Yes. You can replace the sample data with your own sales records.
Does it include pivot tables?
Yes. The workbook includes a pivot analysis section for reviewing sales by region, category, month, manager, and seller.