
Case study / Published Completo product
Turn sales records into a readable report.
An interactive Excel dashboard for revenue, profit, regions and order status.
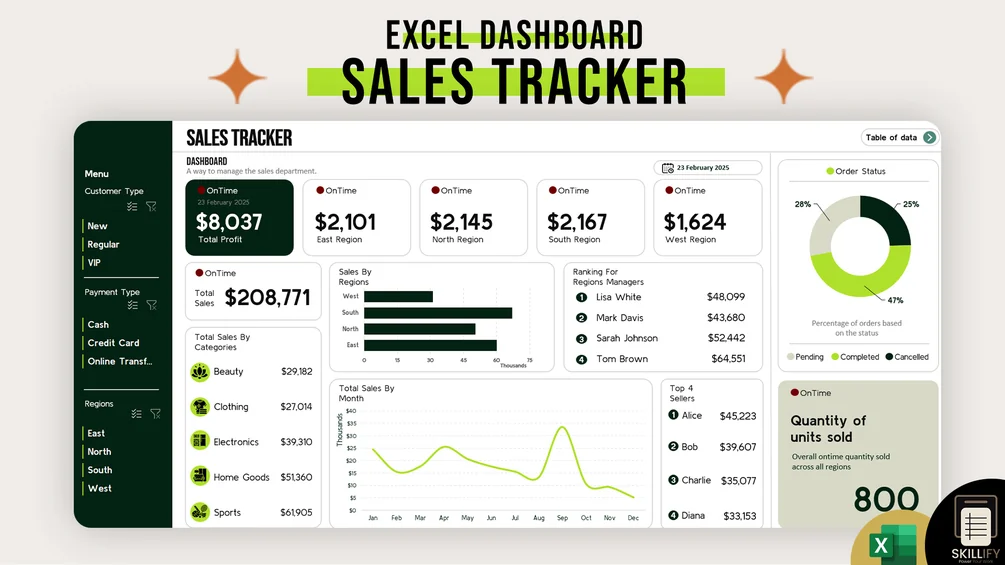
The business problem
A transaction list contains business information, but comparing regions, sellers, payment types and order statuses requires a consistent reporting structure.
Intended users
Small business owners, sales managers and online sellers reporting on sales records.
Requirements & constraints
- Accept sales data in an Excel workbook.
- Summarize sales and profit with charts and filters.
- Allow users to compare regions, sellers and order statuses.
My contribution
Created and published the Excel sales dashboard workbook and its setup guide.
How the workflow functions
- Enter or import sales records into the workbook.
- Review summary metrics and visual trends.
- Use filters to compare regions, payment methods and order statuses.
- Check summary totals against the underlying sales records.
Design choices
- Use a reusable Excel workbook so users can work with familiar spreadsheet data.
- Combine summary metrics and interactive breakdowns so a report supports both overview and investigation.
- Keep labels, data and filters customizable for different businesses.
Demonstrated functionality
The published workbook demonstrates sales and profit summaries with interactive reporting. No measured revenue improvement or reporting-time reduction is available.
Limitations & possible improvements
- Designed for Microsoft Excel; Google Sheets compatibility has not been verified.
- The report depends on accurate source records and consistent categories.
- It does not automatically connect to a sales platform.
For a custom engagement, define source data validation and reconcile reported revenue with the business’s accounting records.